Value stream mapping is a term that originally came from lean manufacturing. It’s made it way into the software industry fairly recently, and it’s all about visualizing the process. And continuous learning is an iterative process for improving. The two are related.
Value stream mapping creates a path to collaboration. When people come together as a team, they create opportunities to win through learning. A large value stream map at Nike, where Kissler is the VP of Nike Digital Platform Engineering, needs to be visualized on a map in order to get the whole picture. Observing through “listening, listening, and more listening” enables you to inform the right path forward.
At a large organization the scale of Nike, there’s quite a bit involved in getting work done more efficiently. A plethora of various processes still left bottlenecks. So the agile coaches and the teams worked together to map the handoffs using the Accelerate State of DevOps Report as a guidepost. A few key elements to the process are:
- Effective planning—this is about “doing” and sprint stability.
- Operations/support—MTTR, MTTD, and other metrics can be used to improve. But you have to take these a step further and look for the roots of the measurements.
- Speed to value—measuring cycle time and deployment frequency can be used to indicate how much value can be delivered and how quickly.
- Prioritization—this is all about keeping work on task to deliver the goals.
- Team health—a feedback-driven score that can be used to understand which things are working for teams and where there may be a need for improvement.
Yet another key factor to success is joint ownership and implementation. From senior leadership to the newest member of the team, it’s all hands in! This style of ownership frees up team members so they can focus on what’s important.
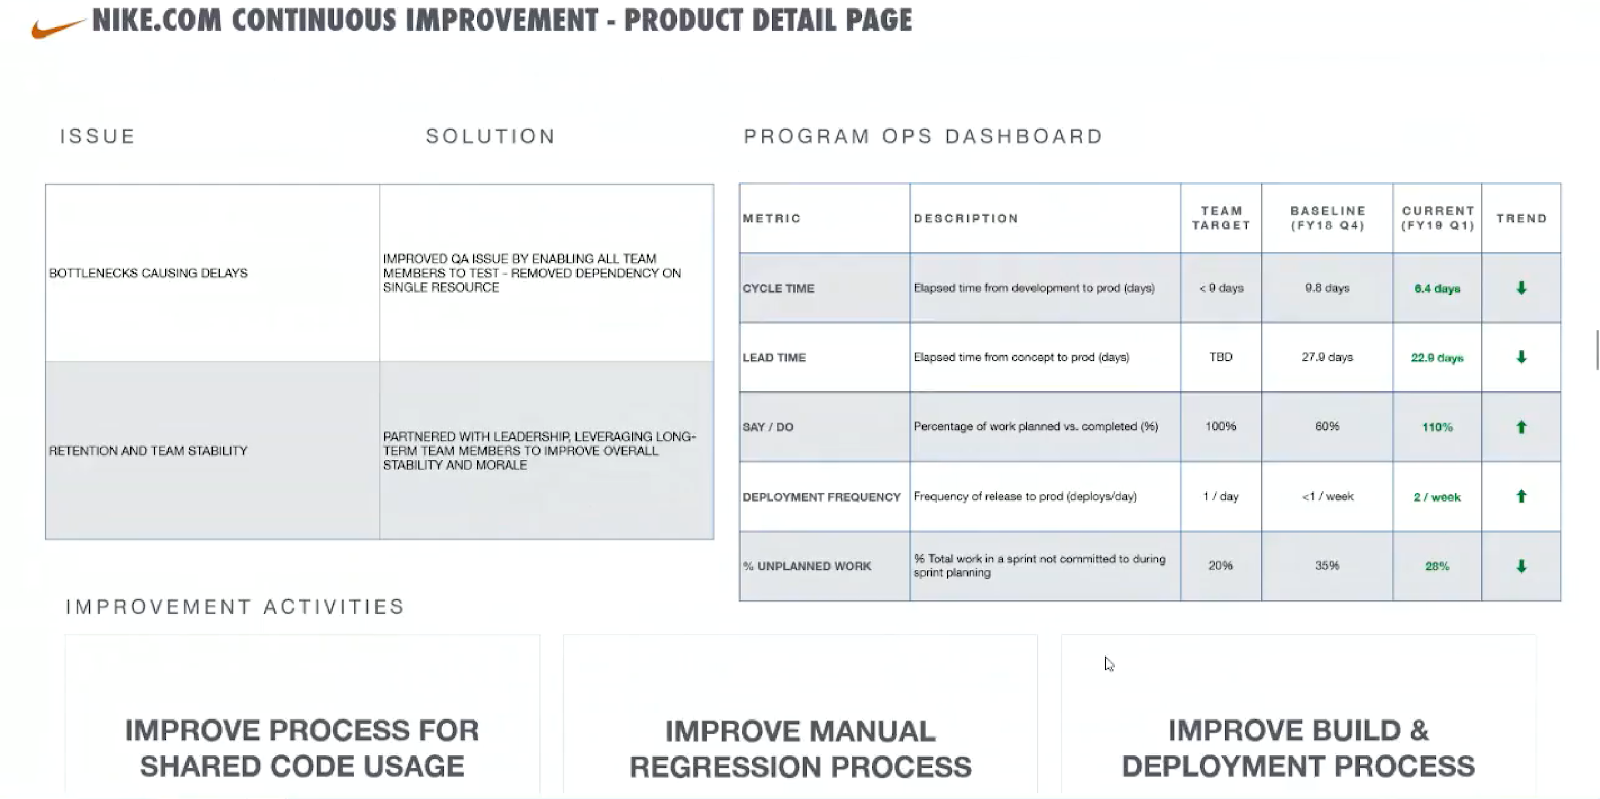
Kissler uses a “Product Detail Page” (shown below) as a sample for measurements to show these metrics. The team had some aggressive goals, as you can see from the program ops dashboard. That’s what shows the target and the baseline compared to present measurement. And it shows all five areas of the process mentioned earlier.

A different team at Nike is the Mobile POS feature team. They release monthly, but that’s aligned with their cycle time: 60 days. So they really needed to bring their cycle time down in order to meet their release cadence. This team’s lead time—a measurement of how many days it takes from getting a new story to delivering the story to production—is 90 days.
But the CD team, through the process improvement, has learned a lot! They need to deliver fast, so they have quick cycle time but a very long lead time. But, stories take awhile to get into the implementation pipeline. So, their lead time isn’t where they’d like it yet. And that’s where they’ll focus on improvement.
One key technique the teams used is the A3 problem-solving framework. Like the concept of value stream mapping, this framework comes from lean manufacturing. Kissler shared a “5-Fishbones” diagram for root cause analysis. This is basically a fishbone diagram showing the five-whys analysis. And it’s helping them find problems, propose solutions (experiments), measure, learn, and reiterate over this process. Really, this is about continual improvement. Leadership support is critical to successful improvement. Without the space and support, these efforts are bound to fail.
So, always look for strong leadership to support change and allow experimentation in the name of improvement, and you’ll be on the right track!
***
Missed Courtney Kissler’s session, or want to see some other great presentations from October 17? Head over to https://www.alldaydevops.com/live and make sure you’re registered. Then, catch up on what you missed (or re-watch your favorites)!
About the author, Phil Vuollet


.png?width=610&name=J1_ModernCybersecurityBook_Promo%201200x628%20v2@2x%20(1).png)


